


-
- Trading Platforms
- PU Prime App
- MetaTrader 5
- MetaTrader 4
- PU Copy Trading
- Web Trader
- PU Social
-
- Trading Conditions
- Account Types
- Spreads, Costs & Swaps
- Deposits & Withdrawals
- Fee & Charges
- Trading Hours


EN
10 July 2025,03:42
Chart The Market
10 July 2025, 03:42

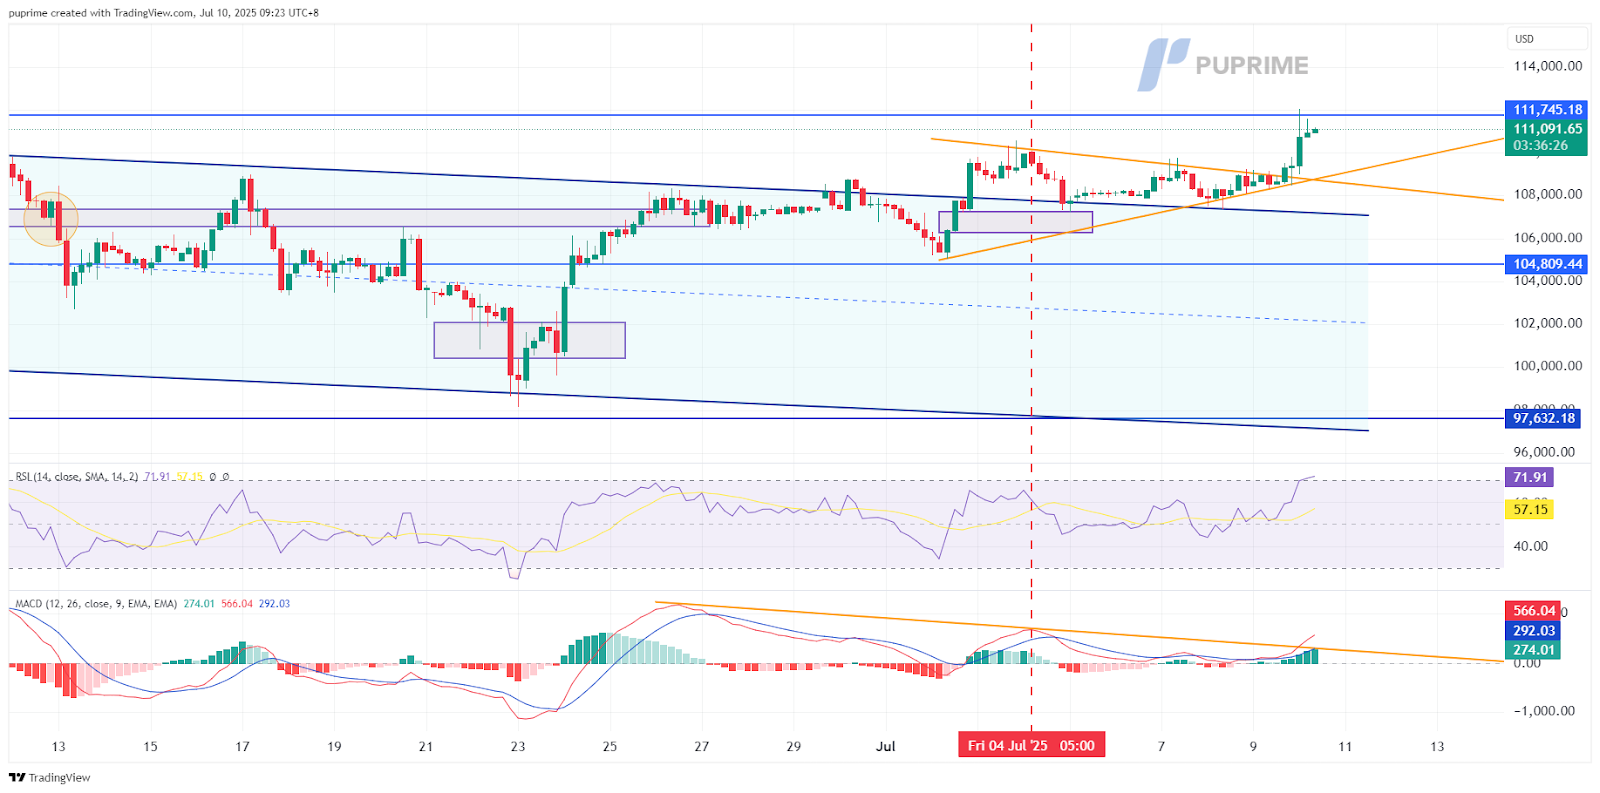
BTC, H4:
Bitcoin has decisively broken above a key ascending wedge and cleared the upper boundary of the fair value gap (FVG) around $107,000, with price surging toward the $111,745 zone. This marks a bullish continuation after a period of sideways consolidation and accumulation near the mid-FVG range. The breakout signals a shift in short-term market structure, with bulls regaining control and aiming for a potential retest of the broader descending channel resistance.
The Relative Strength Index (RSI) has accelerated to 72, entering overbought territory. While this highlights strong upside momentum, it also warrants caution as the rally may face short-term exhaustion unless momentum is sustained above the 70 mark.
The MACD presents a mixed but improving picture. Although a potential bearish divergence had been forming, the MACD line has now crossed above the signal line with increasing histogram bars, indicating renewed bullish momentum. Still, the prior divergence and stretched conditions suggest that any failure to maintain current levels could trigger a retest of the breakout zone near $107,000.
As it stands, the $111,745 level serves as immediate resistance, and a clean break above this could open the door toward $114,000. On the downside, the rising wedge support and FVG floor around $107,000 now act as first-line defense. A breakdown below that would negate the current bullish impulse and shift focus back to the $104,809 zone.
Resistance Levels: 111,745.00, 112,747.00
Support Levels: 104,809.00, 103,165.00
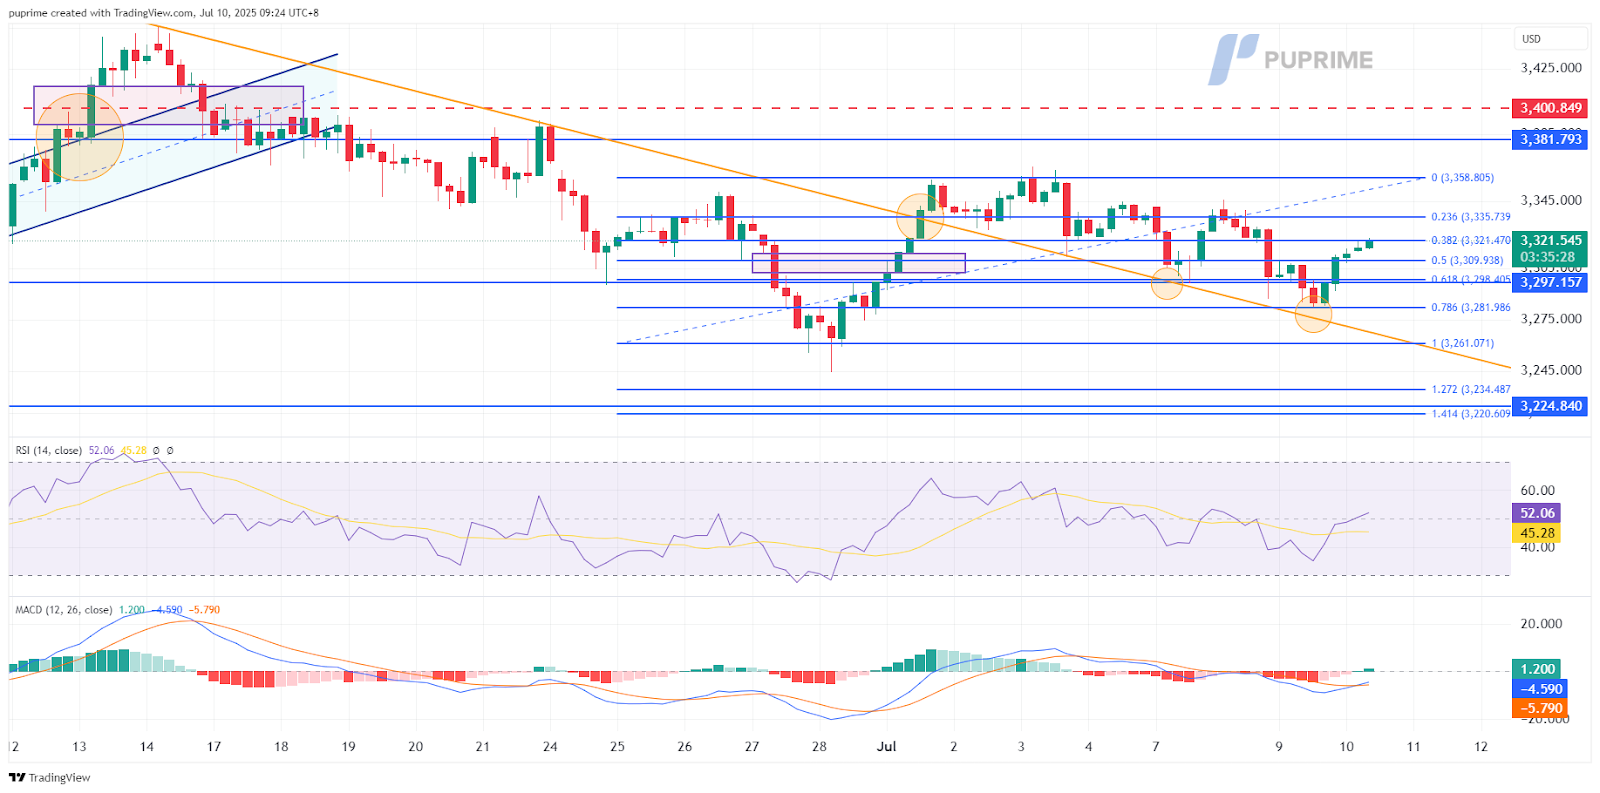
XAUUSD, H4
Gold prices have staged a cautious recovery, rebounding from the 78.6% Fibonacci retracement level near $3,281 after successfully retesting a key descending trendline now acting as support. The formation of higher lows and bullish engulfing candles suggest early signs of accumulation, with price now hovering around the $3,321 region—just below the 38.2% retracement level. This short-term structure hints at a potential shift in bias, but the overall setup remains fragile.
Momentum signals, however, reveal a more conflicted picture. The Relative Strength Index (RSI) has nudged higher to 52, reclaiming neutral ground but struggling to extend into bullish territory. This tepid RSI rebound reflects hesitant buying pressure and suggests the recovery is not yet conviction-driven.
The MACD paints a similarly cautious tone. Although the MACD line is attempting to cross above the signal line from deeply negative levels, the histogram remains shallow and lacks momentum. This indicates that while downside pressure has eased, bullish strength is still nascent and could fade without a strong catalyst.
The $3,335–$3,358 zone remains the immediate resistance to watch. A decisive break above this would mark a meaningful technical reclaim and potentially open the path toward $3,358. Conversely, failure to sustain gains above the $3,298–$3,310 region risks a renewed push toward $3,281 or even $3,261. The next few candles will be crucial in determining whether this bounce has legs or merely serves as a corrective uptick within a broader bearish retracement.
Resistance Levels: 3335.00, 3358.00
Support Levels: 3310.00, 3298.00

Trade forex, indices, metal, and more at industry-low spreads and lightning-fast execution.
Sign up for a PU Prime Live Account with our hassle-free process.
Effortlessly fund your account with a wide range of channels and accepted currencies.
Access hundreds of instruments under market-leading trading conditions.
Trading Platforms
Learn
About PU Prime
Corporate